5.22 Debugging and Diagnostic Tools
Dissect OpenCode like a developer
📝 Course Notes
Key takeaways from this lesson:
🎒 Before You Start
- Basic command line operations
- Have encountered hard-to-trace bugs or configuration issues
Core Concept
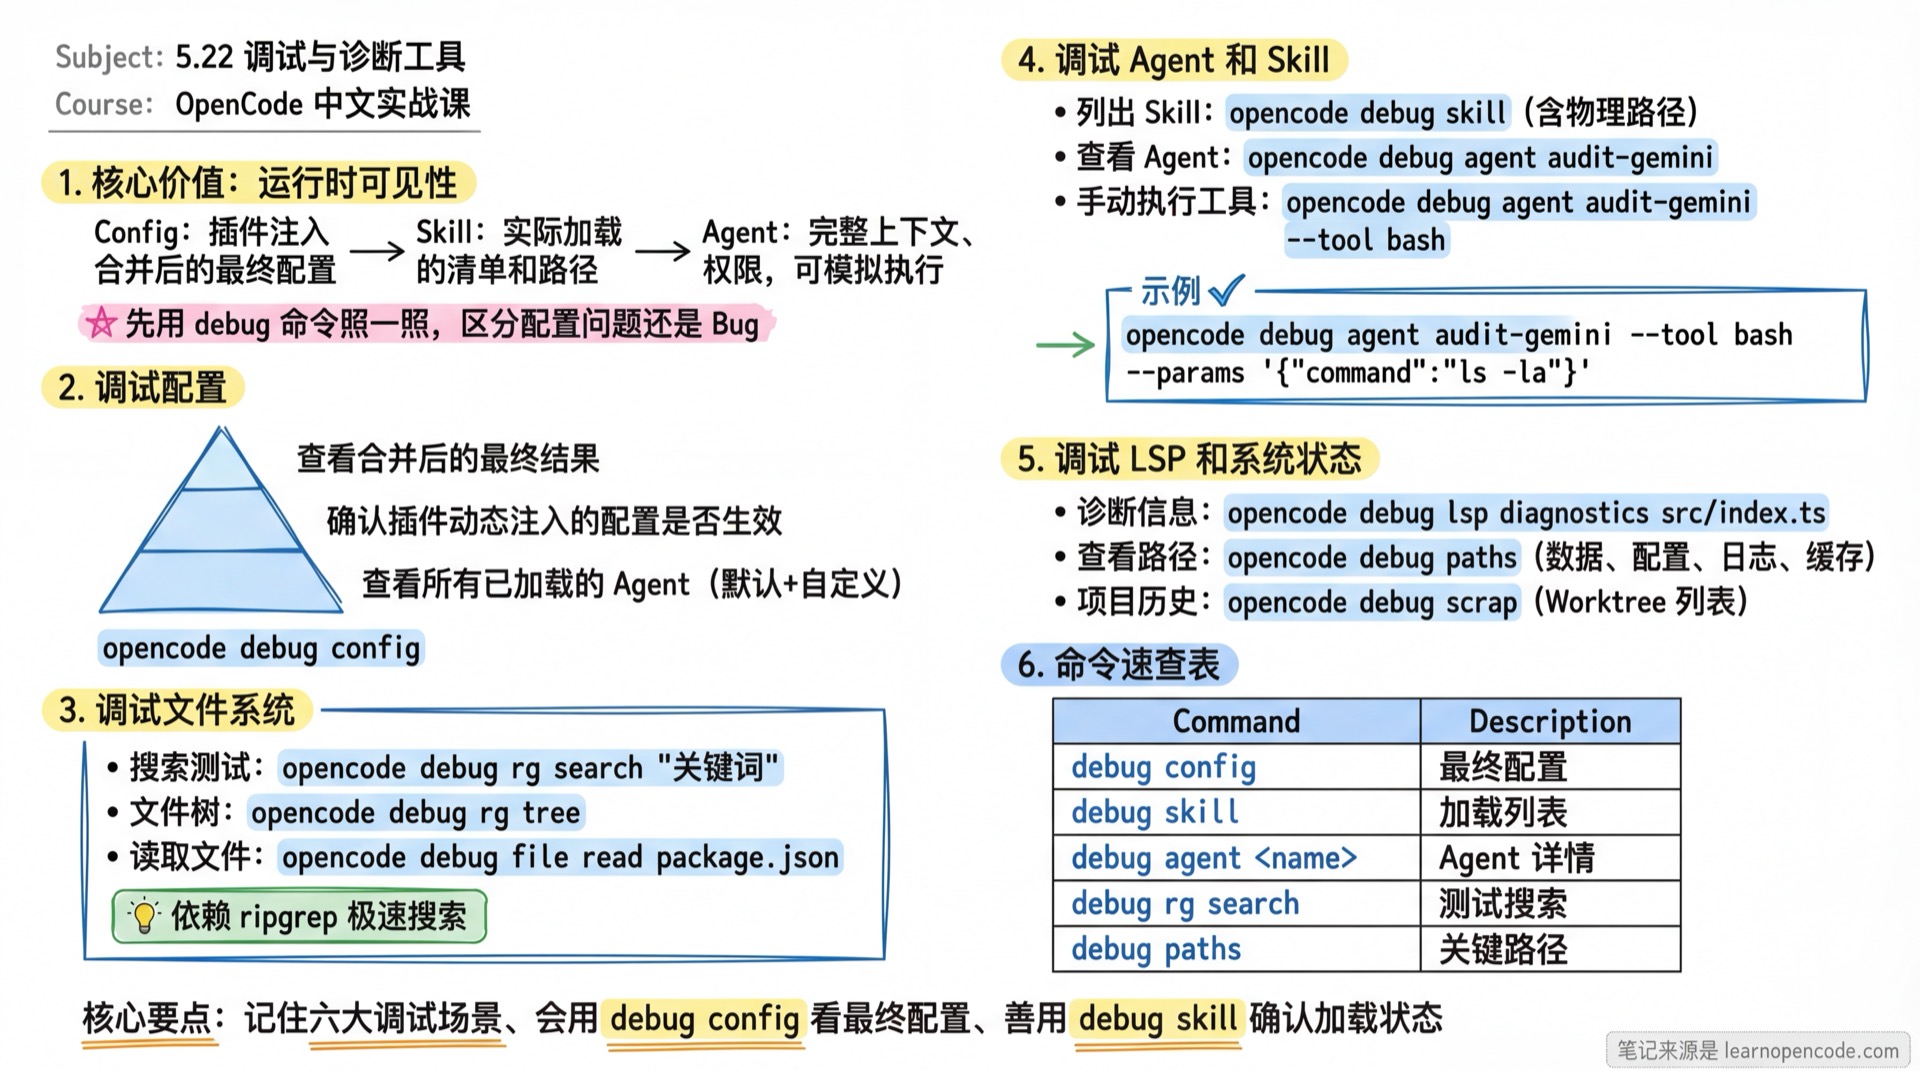
OpenCode has a powerful debugging toolkit built in: opencode debug. These tools are not only for development debugging but also help advanced users diagnose configuration errors, file system issues, and abnormal AI behavior.
Follow Along
1. Debug Configuration (Config)
Want to know how your configuration actually takes effect?
Important scenario: OpenCode's configuration doesn't just come from opencode.json—plugins can also dynamically inject configuration at startup.
If you want to confirm:
- Whether a plugin's injected configuration is in effect?
- What the final result is after merging defaults, user config, and plugin config?
Use this command:
opencode debug configExample output (excerpt):
{
  "$schema": "https://opencode.ai/config.json",
  "keybinds": { ... },
  // Lists all loaded Agents (including default and custom)
  "agent": {
    "coder": { ... },
    "writer": { ... },
    "my-custom-agent": { ... } // Confirm if custom Agent exists
  },
  // May contain plugin-injected configuration
  "plugin_injected_config": { ... }
}
💡 How to see which Agents are loaded?
Look directly at the agent field in the opencode debug config output. It lists all registered and available Agents. If an Agent isn't here, the definition file has issues, or OpenCode didn't scan it.
2. Debug File System (File & Ripgrep)
OpenCode relies on ripgrep for ultra-fast search. If search results don't meet expectations, use these commands to troubleshoot.
Check search behavior:
# Test search
opencode debug rg search "keyword"

# View file tree (directory structure as OpenCode sees it)
opencode debug rg tree
Check file reading:
# Read file contents (in JSON format, with metadata)
opencode debug file read package.json
3. Debug Agents and Skills
When you've installed many plugins or manually added many Skills, you may encounter the "I installed it but don't know if it's working" situation.
Use this command to quickly know which Skills OpenCode has actually loaded. It lists Skill names and physical paths—the ultimate way to troubleshoot conflicts.
List actually loaded Skills:
opencode debug skillExample output:
[
  {
    "name": "fanyi",
    "description": "...",
    // Confirm which file path is loaded
    "location": "/Users/user/.claude/skills/fanyi/SKILL.md"
  },
  {
    "name": "sync-changelog",
    // Confirm if it overrode a same-named Skill
    "location": "/Users/user/.config/opencode/skill/sync-changelog/SKILL.md"
  }
]
View Agent configuration details:
# View audit-gemini's full config (including permissions, prompts)
opencode debug agent audit-gemini
[Advanced] Manually execute Agent tools: Want to test if an Agent can successfully call a certain tool? Test it directly:
# Test audit-gemini using bash tool
opencode debug agent audit-gemini --tool bash --params '{"command":"ls -la"}'
List all Skills:
opencode debug skill4. Debug LSP (Language Server)
If code completion or go-to-definition isn't working, there may be an LSP issue.
# Get diagnostics for a file (errors/warnings)
opencode debug lsp diagnostics src/index.ts

# Search workspace symbols
opencode debug lsp symbols "AppController"

# Get symbol structure for a single file
opencode debug lsp document-symbols src/index.ts
5. View System Status (Paths & Scrap)
View key paths: Don't know where data is stored?
opencode debug pathsExample output:
data       /Users/username/.local/share/opencode
config     /Users/username/.config/opencode
log        /Users/username/.local/share/opencode/log
cache      /Users/username/.cache/opencode
View project history (Scrap): OpenCode records all projects (Worktrees) you've opened.
opencode debug scrap6. Debug Snapshots
OpenCode's context compression relies on a snapshot mechanism.
# Track current snapshot state
opencode debug snapshot track

# View snapshot diff
opencode debug snapshot diff <hash>
Command Reference
| Command | Purpose | Typical Use Case |
|---|---|---|
debug config | View final configuration | Check if config is in effect, view default keybindings |
debug agent <name> | View Agent details | Check prompts, permissions, tool list |
debug agent --tool | Manually execute tool | Verify tool parameter format, test tool permissions |
debug skill | List Skills | Confirm if Skill is loaded, view load path |
debug rg search | Test search | Troubleshoot file search issues |
debug file read | Read file | Check if file content reading includes metadata |
debug file status | File status | View Git status integration |
debug paths | View paths | Find log files, confirm paths when clearing cache |
debug lsp | Debug LSP | Troubleshoot code completion/navigation issues |
debug scrap | View project list | Retrieve historical project IDs |
Common Pitfalls
| Symptom | Cause | Solution |
|---|---|---|
command not found | Old OpenCode version | Upgrade to latest |
| Output too long | Large JSON data | Redirect to file with > debug.txt |
debug agent error | Agent name not specified | Must include name, e.g., opencode debug agent coder |
Lesson Summary
The core value of opencode debug commands is "runtime visibility":
- Config: See the final configuration after plugin injection and merging, not just static files.
- Skill: See the actually loaded list and paths, confirming nothing was ignored or overridden.
- Agent: See complete context and permissions, and even simulate execution.
When you suspect OpenCode is "broken," use these commands to take a look first—usually you'll find it's a configuration issue, not a real bug.