5.7c Chrome DevTools MCP in Practice
💡 TL;DR: Let AI connect directly to your Chrome browser so it can debug pages, analyze performance, and work with the DOM.
What You'll Learn
- Configure the Chrome DevTools MCP server
- Let AI connect to your current browser session
- Select elements or requests in DevTools and have AI analyze them
- Debug logged-in pages directly without signing in again
The Problem You're Facing
- You want AI to help debug a web page, but you keep taking screenshots or copying code back and forth
- Problems only appear after login, but AI cannot access the page unless you sign in again
- You spot an issue in DevTools, then have to manually copy the details so AI can explain it
- Chrome is already open, but MCP still says it cannot find
chrome-beta
What Is Chrome DevTools MCP?
Chrome DevTools MCP is Google's official browser MCP. In practice, it gives you three things:
- Direct access to your current Chrome session
- Reuse of your existing logged-in state
- A way to hand DevTools-visible data directly to AI
How It's Different from Traditional Browser Automation
| Comparison | Chrome DevTools MCP | Puppeteer / Playwright / Selenium |
|---|---|---|
| Login state | Reuses your current browser | Usually requires manually managing cookies or tokens |
| Browser instance | Connects to an already open Chrome | Often launches a separate instance |
| Element targeting | uid (a11y tree) | CSS / XPath |
| Debugging perspective | More like reading page semantics | More like inspecting DOM nodes |
What is uid?
Here, uid is a temporary identifier from the page snapshot's accessibility tree. It is not a CSS selector.
The advantage is that it does not depend on class names. The downside is just as clear: once the page refreshes, the uid may change, so you cannot hardcode it.
┌─────────────────────────────────────────────────────────────┐
│                    Chrome DevTools MCP                       │
├─────────────────────────────────────────────────────────────┤
│                                                              │
│   Your browser ◄─────────► MCP server ◄──────────► OpenCode  │
│   (logged-in state)           (local)            (AI Agent)  │
│                                                              │
│   ✓ No need to log in again                                  │
│   ✓ Access to the current session                            │
│   ✓ DevTools capabilities                                    │
│                                                              │
└─────────────────────────────────────────────────────────────┘
Typical Use Cases
| Scenario | Traditional approach | With MCP |
|---|---|---|
| Debugging logged-in pages | Screenshots + copied code | AI accesses the browser directly |
| Analyzing network requests | Manually copy request details | AI reads the Network panel |
| Inspecting DOM structure | Copy HTML manually | AI works directly with the Elements panel |
| Performance analysis | Export a report for AI | AI reads performance data directly |
Prerequisites
If you remember only one thing, remember this
Use Chrome 146+ and do not put beta in the config. If you normally use stable Chrome, configure the stable channel.
Step 1: Make Sure Chrome Is Version 146 or Later
macOS / Windows / Linux:
Visit the Chrome download page and install the latest version.
Make sure the version is 146 or later by entering chrome://version in Chrome's address bar.
Step 2: Enable Remote Debugging
- Open Chrome
- Enter this in the address bar:
chrome://inspect/#remote-debugging - Click Enable for remote debugging
The page should look roughly like this:
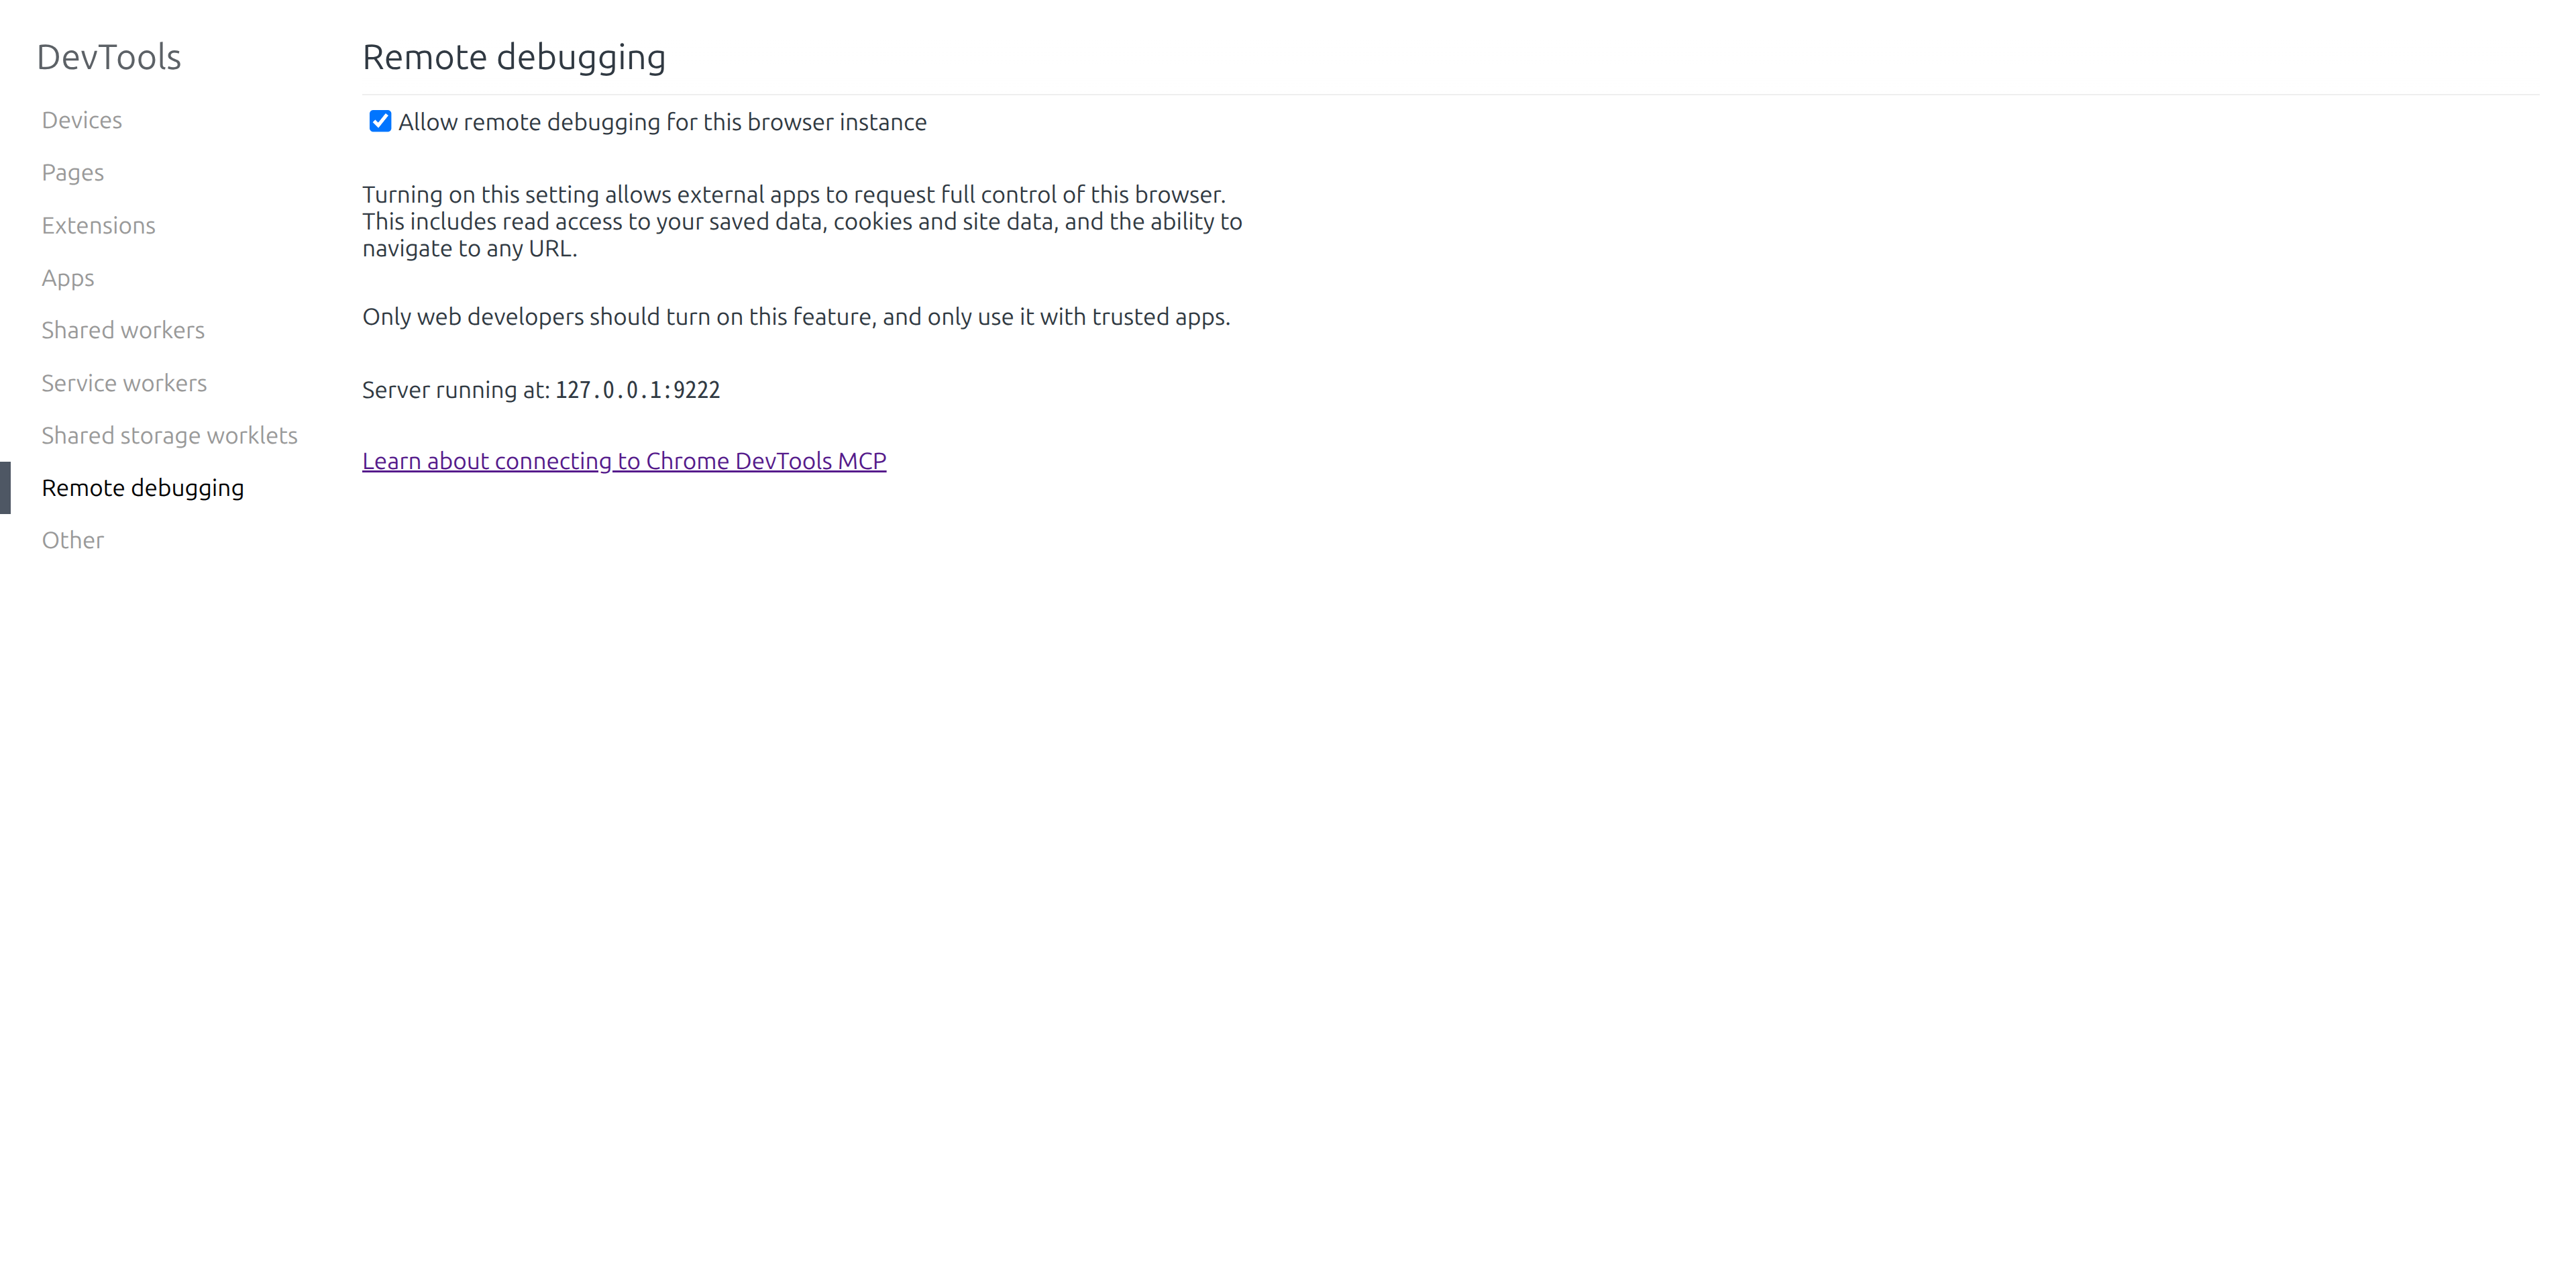
You should see:
┌─────────────────────────────────────────────────────────────┐
│  Remote debugging                                           │
│                                                             │
│  [✓] Discover network targets                               │
│                                                             │
│  Remote debugging is enabled                                │
│                                                             │
│  When MCP servers request a debugging session, Chrome       │
│  will show a permission dialog.                             │
└─────────────────────────────────────────────────────────────┘
Configure the MCP Server
You can configure it directly in the global file ~/.config/opencode/opencode.json:
Option 1: Edit the Config File Manually
Edit ~/.config/opencode/opencode.json or .opencode/opencode.json in your project directory:
{
  "$schema": "https://opencode.ai/config.json",
  "mcp": {
    "chrome-devtools": {
      "type": "local",
      "command": ["npx", "-y", "chrome-devtools-mcp@latest", "--autoConnect", "--channel=stable"],
      "enabled": true
    }
  }
}
Parameter notes:
| Parameter | Meaning |
|---|---|
--autoConnect | Automatically connects to the currently active Chrome instance |
--channel=stable | Explicitly uses stable Chrome and avoids channel confusion |
If you prefer an interactive setup, you can also run:
opencode mcp addVerify the Connection
Check MCP Status
opencode mcp listYou should see:
✓ chrome-devtools connected
    npx -y chrome-devtools-mcp@latest --autoConnect
Test It in OpenCode
After restarting OpenCode, enter:
List the browser tabs that are currently openYou do not need to explicitly say use chrome-devtools. Just describe what you want in plain language. When MCP is needed, OpenCode will call it automatically.
On the first connection, Chrome will show a permission dialog:
┌─────────────────────────────────────────────────────────────┐
│  Chrome                                                     │
│                                                             │
│  "chrome-devtools-mcp" wants to start a remote debugging   │
│  session with Chrome.                                       │
│                                                             │
│  [Allow]  [Block]                                           │
└─────────────────────────────────────────────────────────────┘
Click Allow to grant access.
Once connected, Chrome will show this banner at the top:
┌─────────────────────────────────────────────────────────────┐
│  Chrome is being controlled by automated test software.     │
└─────────────────────────────────────────────────────────────┘
If the config still doesn't take effect
Quit OpenCode completely, then open it again. A stale MCP process is often the reason.
What This MCP Can Actually Do
Do not think of it as just "a browser for AI." Its real strengths fall into three groups.
Operate the Page Directly
- Open pages, switch tabs, go back and forward, and refresh
- Take screenshots, read page snapshots, click, type, and send key presses
- Upload files, handle dialogs, and drag elements
This is the most intuitive kind of automation: the actions you normally perform by hand are now handled by AI.
Read Debugging Data Directly
- Check console errors
- Inspect network requests and responses
- Examine page structure and the accessibility tree
- Run Lighthouse audits
- Record performance traces and analyze LCP / INP / CLS
- Capture memory snapshots
These capabilities are ideal for frontend debugging. Instead of taking screenshots, copying error messages, or exporting HAR files, AI can inspect the live page directly.
Reuse the Logged-In State of Your Current Browser
- No need to pass cookies separately
- No need to log in again
- No need to manage tokens or sessions on the side
- If you can see the page in your browser, AI can usually continue from there
This is the most powerful part. In many browser tasks, the hard part is not "click the button" but "get into the real logged-in page state first."
Before this, you often had to:
- Extract cookies yourself
- Handle expired sessions
- Deal with two-factor authentication or anti-abuse checks
- Find a way to pass page state back to AI
Now the workflow flips: you log in normally, and AI picks up from your browser session.
Where It Really Beats Traditional Browser Automation
- Traditional automation often launches a new browser and makes you manage login state again
- Chrome DevTools MCP attaches directly to your existing session
- Traditional tools lean more toward scripts and selectors
- This MCP is better suited to AI that inspects the page, decides what to do, and keeps going
In one sentence: traditional automation is more like "you script the browser," while Chrome DevTools MCP is more like "AI takes over the browser you already have open."
The Most Practical Scenarios
- Debugging logged-in pages: admin panels, dashboards, member pages, authenticated workspaces
- Troubleshooting web issues: Network, Console, Elements, and Performance
- Content operations: posting, organizing timelines, collecting information, and creating Markdown summaries
- Forms and back-office tasks: repetitive form filling, batch entry, and attachment uploads
- Website inspection: screenshots, performance audits, and regression checks
- Using the web as a workflow node: ask an AI on the page for input, then continue the automation
One Level Higher: It Can Form a Complete Workflow
The real power is not a single action. It is the whole chain:
- Open a page
- Read the page state
- Decide the next step
- Click or type
- Read the result again
- Continue the flow or generate a report
So this is more than "browser automation." It is closer to a web workflow engine with visual context.
Real Cases That Worked in Practice
| Case | Actual result | Capability used |
|---|---|---|
| Connect to the current Chrome | Successfully listed 28 tabs | list_pages |
| Read the current page | Successfully retrieved a page snapshot | take_snapshot |
| Post on X | Successfully published a test post | Navigation, clicking, typing |
| Organize an X timeline | Captured 14 posts and wrote them to x_timeline.md | Navigation, waiting, snapshots, file writing |
| Ask Grok and follow accounts | Had Grok recommend AI accounts, then followed them | Multi-step page actions |
Four Takeaways to Remember First
| What you see | What you should actually do |
|---|---|
chrome-beta not found | Do not configure beta. Use stable Chrome directly |
| The user says "Chrome is already open" | First confirm it is the same Chrome channel/version |
| The old error persists after updating config | Suspect a stale MCP process first and restart OpenCode |
list_pages succeeds | Follow up with take_snapshot or a screenshot to confirm the connection is real |
Practical Examples
Example 1: View Browser Tabs
List all currently open tabsAI will call the chrome-devtools_list_pages tool and return something like this:
[
  { "pageId": 1, "title": "OpenCode Tutorial", "url": "https://learnopencode.com" },
  { "pageId": 2, "title": "GitHub", "url": "https://github.com" }
]
Example 2: Take a Screenshot of the Current Page
Take a screenshot of the current pageAI will call chrome-devtools_take_screenshot and return a screenshot.
Example 3: Post Directly to X
This was tested successfully in a real run:
On the X home page, help me post this: This message was sent by OpenCode through MCPResult: the post was published successfully.
This example shows the key point clearly: it does not just read pages. It can actually operate your currently logged-in browser.
When automating actions, slow things down on purpose
AI does not naturally operate at "human speed." For actions like posting, liking, following, repeated clicking, or filling lots of forms, moving too quickly can trigger anti-abuse systems.
It is a good idea to make the instruction explicit:
Operate more slowly and mimic a real person's pace. Wait 2-3 seconds between each step, and do not click rapidly in succession.If the platform is more sensitive, be even more conservative:
Make this interaction feel as human as possible. After the page changes, wait before continuing; pause 3-5 seconds after each click.Example 4: Analyze a Network Request
Select a request in Chrome DevTools' Network panel, then ask AI:
I selected a failed API request. Help me analyze why it failed.AI can read the selected request and analyze the cause.
You can make the prompt more specific like this:
I selected a 401 request in the Network panel. Check whether the problem is with cookies, the Authorization header, or CORS.Example 5: Inspect a Page Element
Select an element in the Elements panel:
This is especially useful when you need to figure out why a button cannot be clicked, why a style is being overridden, or why spacing looks wrong.
I selected a button element. Help me identify any problems with its CSS styles.Example 6: Execute JavaScript
Run console.log('Hello from OpenCode') on the current pageExample 7: Debug a Logged-In Page
Help me check whether the current page's login state looks normalAI can access your logged-in session directly without requiring another sign-in.
This is one of its most practical strengths. Many issues only appear on pages that are logged in, backed by real data, and subject to real permissions. In those cases, screenshots and verbal descriptions are far less useful than letting AI inspect the browser directly.
Example 8: Turn a Timeline into Markdown
This is another real task that works especially well for content workflows:
Turn the timeline from the accounts I follow on X into a Markdown fileResult: it captured the timeline content and organized it into x_timeline.md.
If you regularly collect information, track an industry, or curate content excerpts, this is a very practical pattern.
Example 9: Use an AI Inside the Browser to Do More Work
This multi-step workflow was also tested:
- Open Grok inside X
- Ask it to recommend a few AI accounts worth following
- Go follow those accounts
This shows that Chrome DevTools MCP is not just about automated clicking. It can treat the website itself as part of the workflow.
Common Tool Examples
Chrome DevTools MCP includes many tools. For now, these are the high-frequency ones worth remembering first:
| Tool | Function |
|---|---|
list_pages | List all open tabs |
select_page | Select a tab |
navigate_page | Navigate to a URL / go forward / go back / refresh |
take_snapshot | Get a page snapshot (accessibility tree) |
take_screenshot | Capture a screenshot of a page or element |
click | Click an element |
fill | Fill a form field |
type_text | Type text |
press_key | Send keyboard input |
hover | Hover over an element |
evaluate_script | Execute JavaScript |
list_network_requests | List network requests |
get_network_request | Get request details |
list_console_messages | List console messages |
lighthouse_audit | Run a Lighthouse audit |
performance_start_trace | Start a performance trace |
performance_stop_trace | Stop a performance trace |
If you plan to use it in more complete workflows, this next group is also worth knowing:
| Tool | When to use it |
|---|---|
new_page | Open a new tab for search, login, or redirect testing |
close_page | Close tabs when the flow gets too spread out |
wait_for | Wait for a page to load, a button to appear, or a result to show up |
drag | Handle drag-and-drop uploads, sortable components, or slider interactions |
fill_form | Fill multiple form fields at once instead of calling fill repeatedly |
handle_dialog | Handle dialogs like alert, confirm, and prompt |
upload_file | Upload images, PDFs, or attachments on a web page |
emulate | Emulate mobile devices, slow networks, geolocation, or light/dark mode |
get_console_message | View the full content of a specific console error |
performance_analyze_insight | Drill deeper into a specific performance insight after recording a trace |
take_memory_snapshot | Capture a heap snapshot when you suspect a memory leak |
You can think of them as three groups:
- Flow control:
new_page,close_page,wait_for - Complex interactions:
drag,fill_form,handle_dialog,upload_file - Deep diagnostics:
emulate,get_console_message,performance_analyze_insight,take_memory_snapshot
Why do all tool names start with chrome-devtools_?
OpenCode registers MCP tools in the format server_name + underscore + tool_name.
So if your configured server name is chrome-devtools, the final tool names become chrome-devtools_list_pages, chrome-devtools_take_snapshot, and so on. This avoids naming collisions between tools from different MCP servers.
Other Startup Modes
Besides --autoConnect, Chrome DevTools MCP also supports other connection methods:
Mode 1: Dedicated User Profile
Use a Chrome profile dedicated to MCP in a clean environment:
{
  "mcp": {
    "chrome-devtools": {
      "type": "local",
      "command": ["npx", "-y", "chrome-devtools-mcp@latest"]
    }
  }
}
This launches a new Chrome instance with a temporary profile.
Mode 2: Connect to a Remote Debugging Port
First close your current Chrome, then start a separate profile with remote debugging enabled. This is safer and better aligned with Chrome's current requirements:
# macOS
/Applications/Google\ Chrome.app/Contents/MacOS/Google\ Chrome --remote-debugging-port=9222 --user-data-dir=/tmp/chrome-profile

# Linux
google-chrome --remote-debugging-port=9222 --user-data-dir=/tmp/chrome-profile

# Windows
"C:\Program Files\Google\Chrome\Application\chrome.exe" --remote-debugging-port=9222 --user-data-dir=%TEMP%\chrome-profile
Then configure MCP to connect:
{
  "mcp": {
    "chrome-devtools": {
      "type": "local",
      "command": ["npx", "-y", "chrome-devtools-mcp@latest", "--browser-url=http://127.0.0.1:9222"]
    }
  }
}
Common Pitfalls
| Symptom | Cause | Fix |
|---|---|---|
Cannot find DevToolsActivePort for chrome-beta | The tool connected to the beta profile directory by mistake | Explicitly add --channel=stable |
| It still looks for beta after you changed the config | An old MCP process in OpenCode is still running | Restart OpenCode and try again |
| Connection times out | Remote debugging is not enabled | Open chrome://inspect/#remote-debugging and enable it |
| The permission dialog never appears | Your Chrome version does not support it | Upgrade to Chrome 144+; the latest stable version is recommended |
| Connection drops immediately after it succeeds | Another debugging client is already attached | Close other DevTools connections |
npx downloads slowly | Network issue | Use a proxy or preinstall with npm i -g chrome-devtools-mcp |
| Web actions trigger anti-abuse systems | AI is clicking or typing too quickly | Explicitly say: "pause 2-5 seconds between each step and mimic human interaction" |
Security Notes
Authorization prompt
Every time an MCP server requests a connection, Chrome will show an authorization dialog. AI can access the browser only after you click "Allow."
During the debugging session, Chrome will display the banner "Chrome is being controlled by automated test software" at the top.
- Allow only trusted MCP servers - Do not approve connection requests from unknown sources casually
- Disconnect after debugging - You can close OpenCode or restart the browser
- Be careful with sensitive actions - AI can access every site where you are already signed in
Lesson Recap
You learned:
- Chrome DevTools MCP - Lets AI connect directly to your browser session
- Prerequisites - Chrome 144+ and remote debugging enabled
- Configuration - Start with
--autoConnect; add--channel=stableif it keeps attaching to beta by mistake - Troubleshooting approach - If you see a
chrome-betaerror, check the channel andDevToolsActivePortfirst - First connection - Chrome shows a permission dialog
- Practical scenarios - Debugging logged-in pages, analyzing network requests, and inspecting elements
- Available tools - Screenshots, navigation, script execution, performance analysis, and more
Related Resources
- 5.7a MCP Basics - Introductory MCP configuration
- 5.7b MCP Advanced - OAuth authentication and permission management
- Official Chrome DevTools MCP documentation
- Chrome DevTools MCP GitHub
Next Lesson Preview
In the next lesson, we will cover IDE integration, so OpenCode can work seamlessly with VS Code, JetBrains IDEs, and more.
Appendix: Source Code References
Click to expand source locations
Last updated: 2026-03-15
| Feature | File path | Lines |
|---|---|---|
| MCP connection entry point | src/mcp/index.ts | 328-531 |
| Local MCP launch commands and environment variables | src/mcp/index.ts | 445-487 |
MCP status definitions (connected / disabled / failed / needs_auth / needs_client_registration) | src/mcp/index.ts | 66-109 |
| MCP tool naming rules (server name prefix) | src/mcp/index.ts | 603-643 |
opencode mcp list command | src/cli/cmd/mcp.ts | 67-136 |
opencode mcp add command | src/cli/cmd/mcp.ts | 418-579 |
MCP config schema (local / remote / oauth / timeout) | src/config/config.ts | 516-576 |
Key constant:
DEFAULT_TIMEOUT = 30000: default timeout for MCP connections (30 seconds)
Key functions:
create(): creates MCP clients forlocalandremotetypesstatus(): aggregates the status of current MCP serverstools(): registers MCP tools in theserver_name_tool_nameformat